Media coverage about what’s happening with home prices can be confusing. A large part of that is due to the type of data being used and what they’re choosing to draw attention to. For home prices, there are two different methods used to compare home prices over different time periods: year-over-year (Y-O-Y) and month-over-month (M-O-M). Here’s an explanation of each.
YEAR-OVER-YEAR (Y-O-Y):
- This comparison measures the change in home prices from the same month or quarter in the previous year. For example, if you’re comparing Y-O-Y home prices for April 2023, you would compare them to the home prices for April 2022.
- Y-O-Y comparisons focus on changes over a one-year period, providing a more comprehensive view of long-term trends. They are usually useful for evaluating annual growth rates and determining if the market is generally appreciating or depreciating.
MONTH-OVER-MONTH (M-O-M):
- This comparison measures the change in home prices from one month to the next. For instance, if you’re comparing M-O-M home prices for April 2023, you would compare them to the home prices for March 2023.
- Meanwhile, M-O-M comparisons analyze changes within a single month, giving a more immediate snapshot of short-term movements and price fluctuations. They are often used to track immediate shifts in demand and supply, seasonal trends, or the impact of specific events on the housing market.
The key difference between Y-O-Y and M-O-M comparisons lies in the time frame being assessed. Both approaches have their own merits and serve different purposes depending on the specific analysis required.
WHY IS THIS DISTINCTION SO IMPORTANT RIGHT NOW?
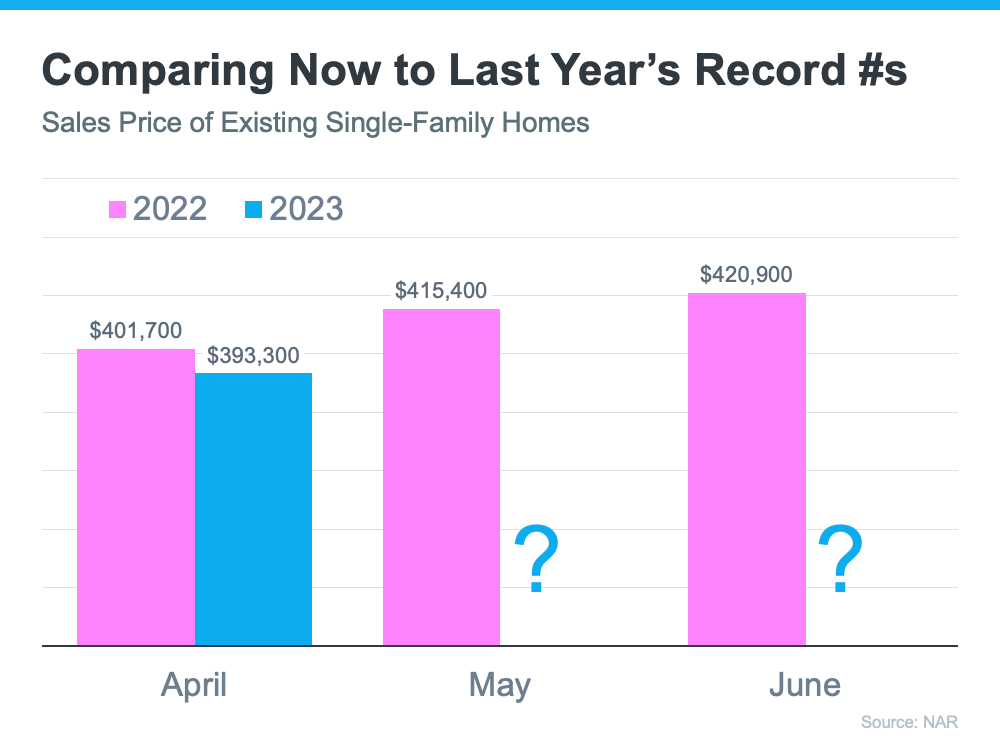
We’re about to enter a few months when home prices could possibly be lower than they were the same month last year. April, May, and June of 2022 were three of the best months for home prices in the history of the American housing market. Those same months this year might not measure up. That means, the Y-O-Y comparison will probably show values are depreciating. The numbers for April seem to suggest that’s what we’ll see in the months ahead (see graph below):
That’ll generate troubling headlines that say home values are falling. That’ll be accurate on a Y-O-Y basis. And, those headlines will lead many consumers to believe that home values are currently cascading downward.
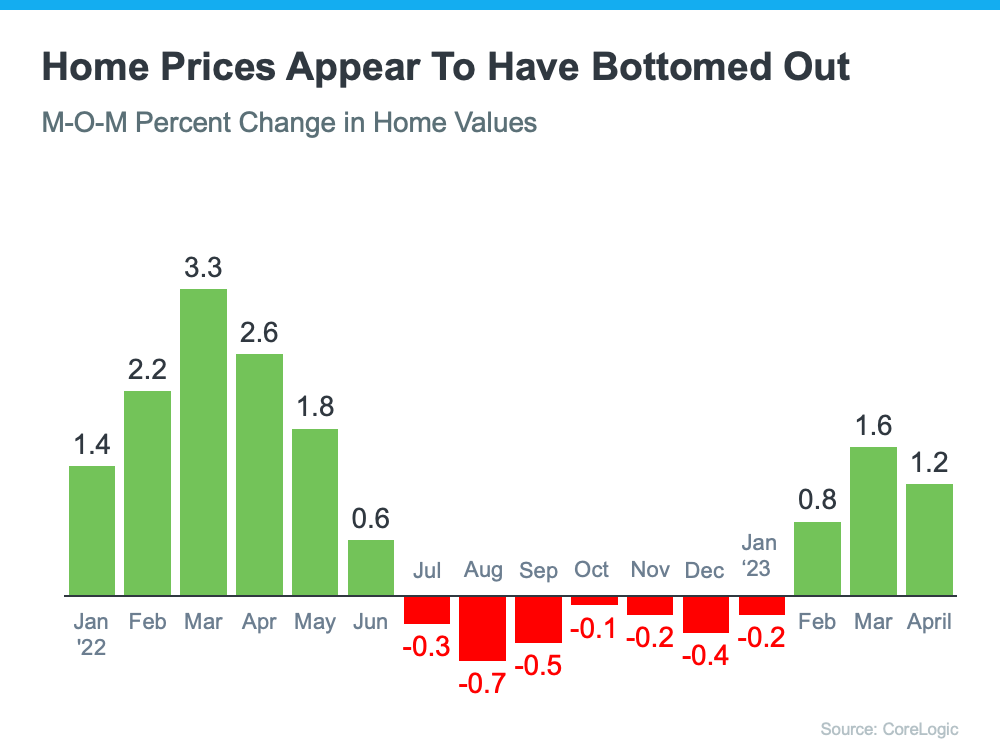
However, on a closer look at M-O-M home prices, we can see prices have actually been appreciating for the last several months. Those M-O-M numbers more accurately reflect what’s truly happening with home values: after several months of depreciation, it appears we’ve hit bottom and are bouncing back.
Here’s an example of M-O-M home price movements for the last 16 months from the CoreLogic Home Price Insights report (see graph below):
SO WHAT IS REALLY HAPPENING AROUND THE MEDIA, WALLINGFORD AND SWARTHMORE AREAS ?
The below chart shows the actual median sales price history for these areas.
| MEDIAN SALES PRICE, ROSE TREE MEDIA, WALL-SWARTH, RADNOR, MARPLE NEWTOWN, SPRINGFIELD | |||||||
| Month | Sale Price | Sale Price | Difference | % Diff | Sale Price | Difference | % Diff |
| 2021 | 2022 | 2022-2021 | 2022-2021 | 2023 | |||
| Jan | $490,000 | $567,000 | $77,000 | 15.7% | $616,376 | $49,376 | 8.7% |
| Feb | $498,000 | $500,000 | $2,000 | 0.4% | $718,000 | $218,000 | 43.6% |
| Mar | $549,500 | $561,519 | $12,019 | 2.2% | $545,000 | ($16,519) | -2.9% |
| Apr | $526,750 | $517,500 | ($9,250) | -1.8% | $555,000 | $37,500 | 7.2% |
| May | $547,500 | $621,000 | $73,500 | 13.4% | $587,000 | ($34,000) | -5.5% |
| Jun | $580,000 | $572,500 | ($7,500) | -1.3% | $575,000 | $2,500 | 0.4% |
| Jul | $580,000 | $554,000 | ($26,000) | -4.5% | |||
| Aug | $534,118 | $620,000 | $85,882 | 16.1% | |||
| Sep | $550,000 | $556,000 | $6,000 | 1.1% | |||
| Oct | $535,000 | $535,000 | $0 | 0.0% | |||
| Nov | $522,000 | $615,000 | $93,000 | 17.8% | |||
| Dec | $500,000 | $500,000 | $0 | 0.0% | |||
| Annual | $534,406 | $559,960 | $25,554 | 4.8% | |||
| Year To Date | $556,587 | $599,396 | $42,810 | 7.7% | |||
| Highlights: | Year over Year Sales Prices Higher in 9 of 12 months in 2022 | ||||||
| Year over Year Sales Prices Higher in 4 of 6 months in 2023 | |||||||
| Real Estate Prices still very strong in Media Area | |||||||
From a sales price perspective, the real estate market in the Media, Wallingford Swarthmore, Radnor, Marple Newton and Springfield Area is VERY STRONG!!!
WHY DOES THIS MATTER TO YOU?
So, if you’re hearing negative headlines about home prices, remember they may not be painting the full picture as it applies to our area. The most credible comparisons are Year over Year trends for at least a few months. Doing it that way, we can see home prices are actually on the way up.
For a first time home buyer, you can be assured that the value of your new house will probably be going up from here.
For the move up buyer, the same holds true. Even with the much higher mortgage rates , home prices are still going up. I expect that trend to continue.
SUGGESTED NEXT STEPS FOR YOU TO MAKE SURE YOU HAVE THE INFORMATION YOU NEED TO MAKE THE RIGHT DECISION
- It’s also important to remember that every local market is different. That’s why it’s essential to lean on an expert for the latest information on the market in your area if you’re planning to make a move. I would like to become that real estate expert upon whom you can lean.
- Do I think that now is a good time to buy that first house or to sell and make that move up buy? Again, absolutely yes.
- To get a quick update of what is new in real estate, click here to check out our new videos.
- Interested in what recent clients think of my service? Click here to read what they say.
- Interested to know what your house is worth? Click here to get the most extensive and accurate estimate of home value that is available on the Internet. No cost or obligation of course.
- No doubt, the housing market is shifting, and it can be a confusing place right now. I suggest that we connect so that I can help you make confident and informed decisions about what’s happening. Minimize the fear or uncertainty that could change your plans. If you’re unsure about how to make sense of what’s going on in today’s housing market, text or call me at 484-574-4088 or go to my web site, (johnherreid.com) and lets set up a time to meet, either on line or in person. I have the software so that we can meet virtually and make the best use of your time.
- If you’re looking to make that move up buy this year, I believe now is a good time to do it. The best way to ensure you’re up to date on the latest market insights is to partner with a trusted real estate advisor. Let’s connect. I would like to interview for the job of becoming your trusted real estate advisor.
- One of the biggest benefits of owning a home, regardless of your income level, is that it provides financial stability and an avenue to build wealth. By selling your house and leveraging your equity, it can be easier to pay for your next home. Let’s connect to find out how much equity you have in your current home and how you can use it to fuel your next purchase.
- There are still clear opportunities for sellers this spring. If you’re wondering if it’s the right time to make a move, let’s connect today.
- There are plenty of buyers out there right now trying to find a home that fits their needs. That’s because the job market is strong, and many people have the stable income needed to seriously consider homeownership. To put your house on the market and get in on the action, let’s connect
- There will be very unsettling headlines around the housing market this year. Most will come from inappropriate comparisons to the ‘unicorn’ years. Let’s connect so you have an expert on your side to help you keep everything in proper perspective.
- If you would rather listen to our 14 minute podcast on this blog post, please just click on the blue hyperlink. Chesco and Delco Home Prices


