Comparing real estate metrics from one year to another can be challenging in a normal housing market. That’s due to possible variability in the market making the comparison less meaningful or accurate. Unpredictable events can have a significant impact on the circumstances and outcomes being compared.
Comparing this year’s numbers to the two ‘unicorn’ years we just experienced is almost worthless. By ‘unicorn,’ what people are trying to convey is this:
“Something that is greatly desired but difficult or impossible to find.”
The pandemic profoundly changed real estate in 2020, 2021 and 2022. Some effects are still being felt, but things are normal enough now so that we can see some local and national trends. Here are some of the pieces.
- Waves of first-time and second-home buyers entered the market.
- Already low mortgage rates were driven to historic lows.
- The forbearance plan all but eliminated foreclosures.
- Home values reached appreciation levels never seen before.
- The demand for a home of our own skyrocketed, and people needed a home office and big backyard.
It was a market that forever had been “greatly desired but difficult or impossible to find.” A ‘unicorn’ year.
Now, things are getting back to normal. The ‘unicorns’ have galloped off.
Comparing today’s market to those years now makes some sense. Here are three examples of national trends and how our local market compares (and is more desirable)
Buyer Demand
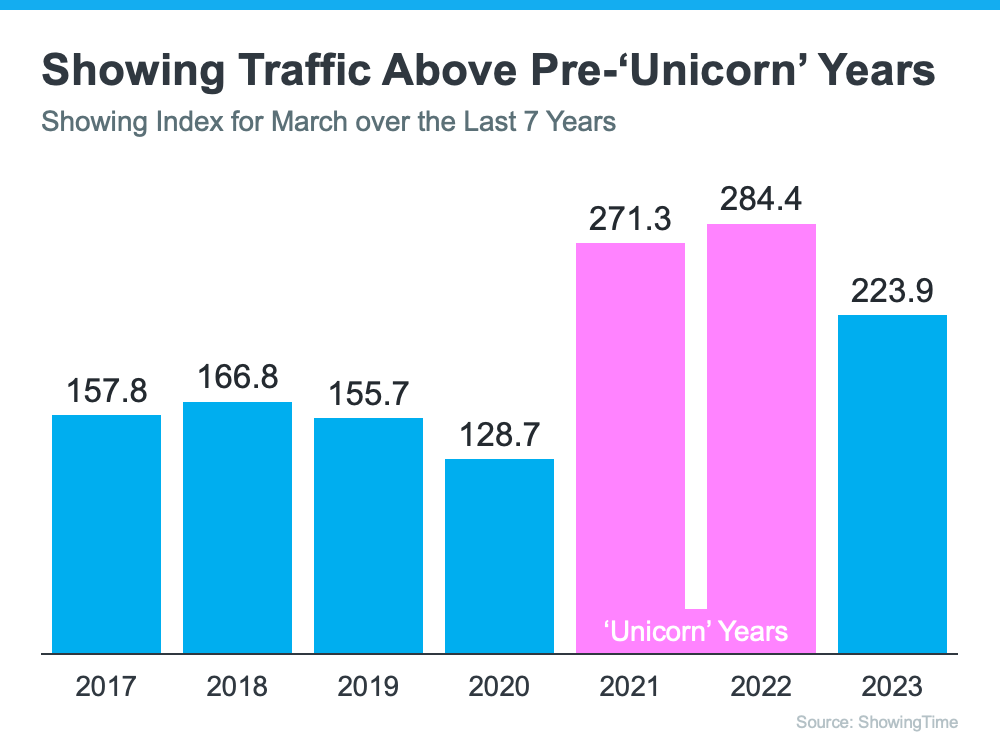
If you look at the headlines, you’d think there aren’t any buyers out there. We still sell over 10,000 houses a day in the United States. Of course, buyer demand is down from the two ‘unicorn’ years. But, according to ShowingTime, if we compare it to normal years (2017-2019), we can see that buyer activity is still strong (see graph below):
So showing activity is up nationallly but what about local? An even better measure of buyer interest is how long it takes a house to get sold. Right now the median days on market in our area is only 6. That compares to 29 days on market just a few years ago.
What this means for sellers is that if you have a house that you want to get on the market (make that move up buy perhaps?), you can be assured that your house will sell quickly if it is priced correctly and marketed well.
Home Prices
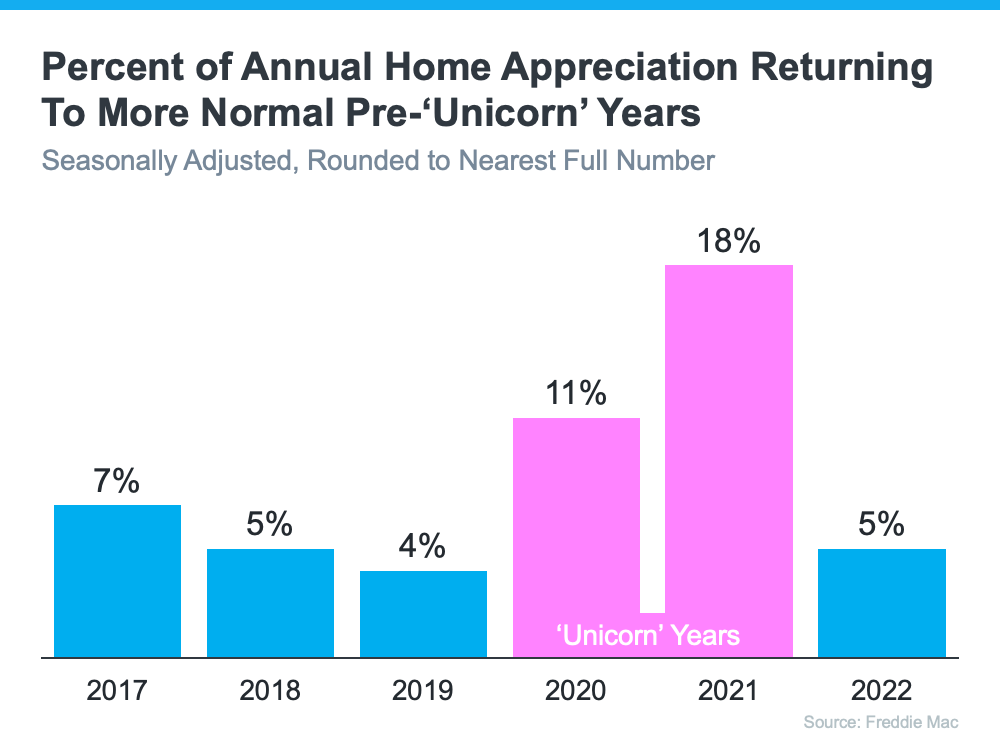
We can’t compare today’s home price increases to the last couple of years. According to Freddie Mac, 2020 and 2021 each had historic appreciation numbers. Here’s a graph also showing the more normal years (2017-2019):
We can see that we’re returning to more normal home value increases. There were several months of minimal depreciation in the second half of 2022. However, according to Fannie Mae, the market has returned to more normal appreciation in the first quarter of this year.
Again, how does this compare to our area. From the above you can see that the national average for home appreciation was 5%. Check out the below chart for the local details.
Median prices were up by 8.6% in 2022; moreover, the trend continued into 2023 with year over year increases in 4 of the first 5 month.
What this means for buyers, both first time and move up, is that if you make that purchase now, you can be reasonably sure that your house will only increase in value in the future.
I would not let the recent rise in interest rates discourage you from making a move. I doubt if we will ever see mortgage rates in the 3-4% range again. If you put off making a move, the most likely effect is that you will miss out on several months (or perhaps years) of price appreciation.
| WEST CHESTER, DOWNINGTOWN, GREAT VALLEY, MEDIAN SALES PRICE, SINGLE FAMILY | ||||||||
| Month | Sale Price | Sale Price | Difference | % Diff | Sale Price | Difference | % Diff | |
| 2021 | 2022 | 2023 | ||||||
| ($) | ($) | ($) | (%) | ($) | ($) | (%) | ||
| Jan | $525,000 | $565,000 | $40,000 | 7.6% | $636,500 | $71,500 | 12.7% | |
| Feb | $577,000 | $554,000 | ($23,000) | -4.0% | $620,000 | $66,000 | 11.9% | |
| Mar | $557,188 | $635,000 | $77,812 | 14.0% | $671,500 | $36,500 | 5.7% | |
| Apr | $557,500 | $685,600 | $128,100 | 23.0% | $660,750 | ($24,850) | -3.6% | |
| May | $591,820 | $657,000 | $65,180 | 11.0% | $723,800 | $66,800 | 10.2% | |
| Jun | $575,000 | $687,977 | $112,977 | 19.6% | ||||
| Jul | $642,500 | $675,000 | $32,500 | 5.1% | ||||
| Aug | $604,000 | $647,500 | $43,500 | 7.2% | ||||
| Sep | $575,000 | $637,401 | $62,401 | 10.9% | ||||
| Oct | $580,000 | $605,000 | $25,000 | 4.3% | ||||
| Nov | $550,000 | $599,500 | $49,500 | 9.0% | ||||
| Dec | $610,000 | $590,000 | ($20,000) | -3.3% | ||||
| Annual | $578,751 | $628,248 | $49,498 | 8.6% | ||||
| Year to Date | $662,510 | $43,190 | ||||||
| Year over Year Up, 10 of 12 months in 2022 | ||||||||
| Year over Year Up, 4 of 5 months Year to Date in 2023 | ||||||||
Foreclosures
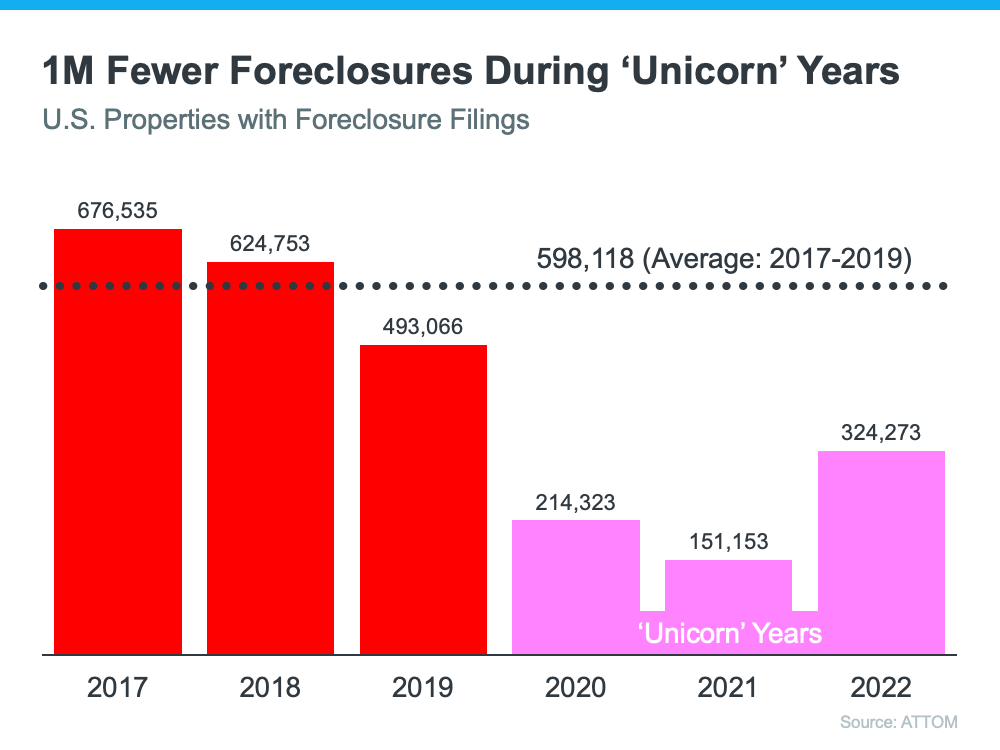
There have already been some startling headlines about the percentage increases in foreclosure filings. Of course, the percentages will be up. They are increases over historically low foreclosure rates. Here’s a graph with information from ATTOM, a property data provider:
There will be an increase over the numbers of the last three years now that the moratorium on foreclosures has ended. There are homeowners who lose their home to foreclosure every year, and it’s heartbreaking for those families. But, if we put the current numbers into perspective, we’ll realize that we’re actually going back to the normal filings from 2017-2019.
I have only anecdotal data on local foreclosures. That comes from associates in the mortgage lending busness. They indicate that they see nothing unusual.
SUGGESTED NEXT STEPS FOR YOU TO MAKE SURE YOU HAVE THE INFORMATION YOU NEED TO MAKE THE RIGHT DECISION
- It’s also important to remember that every local market is different. That’s why it’s essential to lean on an expert for the latest information on the market in your area if you’re planning to make a move.
- Do I think that now is a good time to buy that first house or to sell and make that move up buy? Again, absolutely yes.
- To get a quick update of what is new in real estate, click here to check out our new videos.
- Interested in what recent clients think of my service? Click here to read what they say.
- Interested to know what your house is worth? Click here to get the most extensive and accurate estimate of home value that is available on the Internet. No cost or obligation of course.
- No doubt, the housing market is shifting, and it can be a confusing place right now. I suggest that we connect so that I can help you make confident and informed decisions about what’s happening. Minimize the fear or uncertainty that could change your plans. If you’re unsure about how to make sense of what’s going on in today’s housing market, text or call me at 484-574-4088 or go to my web site, (johnherreid.com) and lets set up a time to meet, either on line or in person. I have the software so that we can meet virtually and make the best use of your time.
- If you’re looking to make that move up buy this year, I believe now is a good time to do it. The best way to ensure you’re up to date on the latest market insights is to partner with a trusted real estate advisor. Let’s connect. I would like to interview for the job of becoming your trusted real estate advisor.
- One of the biggest benefits of owning a home, regardless of your income level, is that it provides financial stability and an avenue to build wealth. By selling your house and leveraging your equity, it can be easier to pay for your next home. Let’s connect to find out how much equity you have in your current home and how you can use it to fuel your next purchase.
- There are still clear opportunities for sellers this spring. If you’re wondering if it’s the right time to make a move, let’s connect today.
- There are plenty of buyers out there right now trying to find a home that fits their needs. That’s because the job market is strong, and many people have the stable income needed to seriously consider homeownership. To put your house on the market and get in on the action, let’s connect
- There will be very unsettling headlines around the housing market this year. Most will come from inappropriate comparisons to the ‘unicorn’ years. Let’s connect so you have an expert on your side to help you keep everything in proper perspective.
- If you would like to listen to our recent 12 minute podcast on this topic, please just click the below hyperlink,
bit.ly/Local_Really_Strong_Real_Estate_Market


