DELAWARE COUNTY Home Values, HAVE WE Hit BottoM?
Whether you’re already a homeowner or you’re looking to become one, the recent headlines about home prices may leave you with more questions than answers. News stories are talking about home prices falling, and that’s raising concerns about a repeat of what happened to prices in the crash in 2008.
One of the questions that’s on many minds, based on those headlines, is: how much will home prices decline? But what you may not realize is expert forecasters aren’t calling for a free fall in prices. In fact, if you look at the latest data, there’s a case to be made that the biggest portion of month-over-month price depreciation nationally may already behind us – and even those numbers weren’t significant declines on the national level. Instead of how far will they drop, the question becomes: have home values hit bottom?
Let’s take a look at the latest data from several reputable industry sources (see chart below):
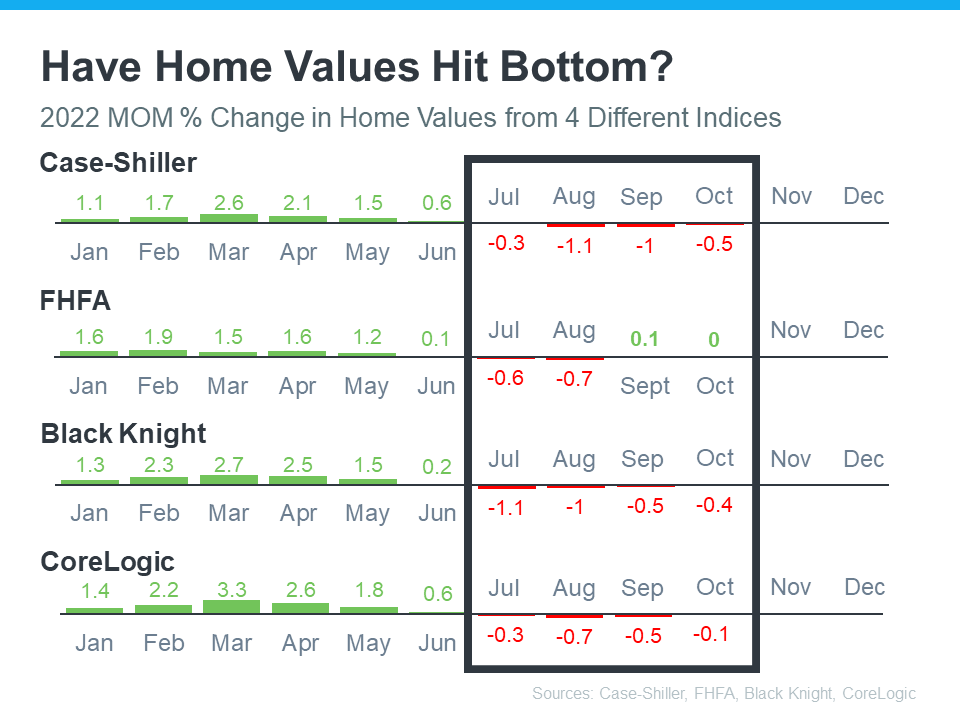
The chart above provides a look at the most recent reports from Case-Shiller, the Federal Housing Finance Agency (FHFA), Black Knight, and CoreLogic. It shows how, on a national scale, home values have changed month-over-month since January 2022. November and December numbers have yet to come out.
Let’s focus in on what the red numbers tell us. The red numbers are the change in home values over the last four months that have been published. And if we isolate the last four months, what the data shows is, in each case, home price depreciation peaked in August.
While that doesn’t guarantee home price depreciation has hit bottom, it confirms prices aren’t in a free fall, and it may be an early signal that the worst is already behind us. As the numbers for November and December are released, data will be able to further validate this national trend.
SO WHAT IS HAPPENING IN DELAWARE COUNTY?
However, it is true in politics and real estate that all the relevant action is local. So, lets take a look at what has happened to median single family home prices in Delaware county. The below chart brings it home for a month by month comparison between 2021 and 2022.
| DELAWARE COUNTY, MEDIAN SALES PRICES | ||||
| 2021 AND 2022 | ||||
| Month | Sale Price, Median 2021 | Sale Price, Median 2022 | Difference | Diff $ |
| Jan | $359,000 | $360,000 | $1,000 | 0.3% |
| Feb | $335,450 | $376,000 | $40,550 | 12.1% |
| Mar | $369,500 | $404,200 | $34,700 | 9.4% |
| Apr | $400,000 | $415,000 | $15,000 | 3.8% |
| May | $400,000 | $427,000 | $27,000 | 6.8% |
| Jun | $410,000 | $451,500 | $41,500 | 10.1% |
| Jul | $425,000 | $420,000 | ($5,000) | -1.2% |
| Aug | $415,000 | $430,000 | $15,000 | 3.6% |
| Sep | $385,000 | $385,000 | $0 | 0.0% |
| Oct | $400,000 | $390,000 | ($10,000) | -2.5% |
| Nov | $384,900 | $410,000 | $25,100 | 6.5% |
| Dec | $380,000 | $420,000 | $40,000 | 10.5% |
| Totals | $388,654 | $407,392 | $18,738 | 4.8% |
Month by month every data point for Delaware county shows increasing year over year home prices for every month in 2022 except July and October
| DELAWARE COUNTY, NUMBER OF SALES, 2021 and 2022 | ||||
| Month | Sales, Number of 2021 | Sales, Number of 2022 | Difference | % Diff |
| Jan | 277 | 259 | 18 | -6.5% |
| Feb | 200 | 227 | 27 | 13.5% |
| Mar | 274 | 282 | 8 | 2.9% |
| Apr | 311 | 301 | 10 | -3.2% |
| May | 350 | 309 | 41 | -11.7% |
| Jun | 507 | 407 | 100 | -19.7% |
| Jul | 457 | 327 | 130 | -28.4% |
| Aug | 402 | 395 | 7 | -1.7% |
| Sep | 358 | 283 | 75 | -20.9% |
| Oct | 355 | 241 | 114 | -32.1% |
| Nov | 370 | 248 | 122 | -33.0% |
| Dec | 345 | 225 | 120 | -34.8% |
| Totals | 4206 | 3504 | 702 | -16.7% |
If one is among the ankle biting nay sayers for whom there is never good news, you could make a case that the real estate market in Delaware county has indeed gone to hell in a hand basket and that dramatic overall collapse must be on the way. Numbers of sales are down in 10 of the 12 months and by almost 17% for the year. That is downer by any measurement.
However, two other major indicators say no. Inventory is still low at only 2 months. That says there are still a lot more buyers than sellers (more demand than there is supply) which is very bullish for prices.
Also, Days on Market is at a low 9 days. That means that when a home comes on the market, if it is well priced and marketed, the seller can reasonably expect to have an acceptable offer in about 9 days. A “normal” market would be about 30 days. This again indicates that we have a lot more buyers than sellers (more demand than there is supply) which is very bullish for prices.
Bottom Line
Nationally, home prices month-over-month have depreciated for the four months of July through October. However, that is not the case for our local market.
If you’re looking to buy or sell a home this year, I believe now is a good time to do it. The best way to ensure you’re up to date on the latest market insights is to partner with a trusted real estate advisor. Let’s connect. I would like to interview for the job of becoming your trusted real estate advisor.
WHAT SHOULD BE NEXT FOR YOU?
If you have questions about home prices or how much equity you have in your current home, let’s connect so you have an expert’s advice.
To get a quick update of what is new in real estate, click here to check out our new videos.
Interested in what recent clients think of my service? Click here to read what they say.
Interested to know what your house is worth? Click here to get the most extensive and accurate estimate of home value that is available on the Internet. No cost or obligation of course.
No doubt, the housing market is shifting, and it can be a confusing place right now. I suggest that we connect so that I can help you make confident and informed decisions about what’s happening. Minimize the fear or uncertainty that could change your plans. If you’re unsure about how to make sense of what’s going on in today’s housing market, text or call me at 484-574-4088 or go to my web site, (johnherreid.com) and lets set up a time to meet, either on line or in person. I have the software so that we can meet virtually and make the best use of your time.